xarray
xarray is a library for labelled multidimensional array objects (dataset and dataarrays).
Tutorial based on excellent guide from Pangeo.
import xarray as xr
import numpy as np
da = xr.DataArray([1, 2, 3])
da
<xarray.DataArray (dim_0: 3)>
array([1, 2, 3])
Dimensions without coordinates: dim_0
xarray.DataArray
- dim_0: 3
- 1 2 3
array([1, 2, 3])
lat = np.arange(-60, 85, 0.25)
lon = np.arange(-180, 180, 0.25)
lat[0:10]
array([-60.  , -59.75, -59.5 , -59.25, -59.  , -58.75, -58.5 , -58.25,
       -58.  , -57.75])
lon[0:10]
array([-180.  , -179.75, -179.5 , -179.25, -179.  , -178.75, -178.5 ,
       -178.25, -178.  , -177.75])
random_array = np.random.rand(np.shape(lat)[0], np.shape(lon)[0])
random_array
array([[0.46790812, 0.70384265, 0.3217949 , ..., 0.99066462, 0.17896173,
        0.75710259],
       [0.56797323, 0.60090187, 0.63837513, ..., 0.86415796, 0.5610759 ,
        0.17693797],
       [0.74666124, 0.17262882, 0.14981358, ..., 0.06162647, 0.462453  ,
        0.94873145],
       ...,
       [0.21474678, 0.60416556, 0.63095547, ..., 0.81648712, 0.3626262 ,
        0.83673775],
       [0.60234326, 0.12133838, 0.90178623, ..., 0.05333163, 0.89202358,
        0.76202533],
       [0.10804089, 0.91367279, 0.38442562, ..., 0.6915072 , 0.09413142,
        0.1209971 ]])
da = xr.DataArray(
    random_array,
    dims=('lat', 'lon'),
    coords={'lat': lat, 'lon': lon}
)
da
<xarray.DataArray (lat: 580, lon: 1440)>
array([[0.46790812, 0.70384265, 0.3217949 , ..., 0.99066462, 0.17896173,
        0.75710259],
       [0.56797323, 0.60090187, 0.63837513, ..., 0.86415796, 0.5610759 ,
        0.17693797],
       [0.74666124, 0.17262882, 0.14981358, ..., 0.06162647, 0.462453  ,
        0.94873145],
       ...,
       [0.21474678, 0.60416556, 0.63095547, ..., 0.81648712, 0.3626262 ,
        0.83673775],
       [0.60234326, 0.12133838, 0.90178623, ..., 0.05333163, 0.89202358,
        0.76202533],
       [0.10804089, 0.91367279, 0.38442562, ..., 0.6915072 , 0.09413142,
        0.1209971 ]])
Coordinates:
  * lat      (lat) float64 -60.0 -59.75 -59.5 -59.25 ... 84.0 84.25 84.5 84.75
  * lon      (lon) float64 -180.0 -179.8 -179.5 -179.2 ... 179.2 179.5 179.8
xarray.DataArray
- lat: 580
- lon: 1440
- 0.4679 0.7038 0.3218 0.1571 0.337 ... 0.7296 0.6915 0.09413 0.121
array([[0.46790812, 0.70384265, 0.3217949 , ..., 0.99066462, 0.17896173, 0.75710259], [0.56797323, 0.60090187, 0.63837513, ..., 0.86415796, 0.5610759 , 0.17693797], [0.74666124, 0.17262882, 0.14981358, ..., 0.06162647, 0.462453 , 0.94873145], ..., [0.21474678, 0.60416556, 0.63095547, ..., 0.81648712, 0.3626262 , 0.83673775], [0.60234326, 0.12133838, 0.90178623, ..., 0.05333163, 0.89202358, 0.76202533], [0.10804089, 0.91367279, 0.38442562, ..., 0.6915072 , 0.09413142, 0.1209971 ]]) - lat(lat)float64-60.0 -59.75 -59.5 ... 84.5 84.75
array([-60. , -59.75, -59.5 , ..., 84.25, 84.5 , 84.75])
- lon(lon)float64-180.0 -179.8 ... 179.5 179.8
array([-180. , -179.75, -179.5 , ..., 179.25, 179.5 , 179.75])
ds = da.to_dataset(name='random_array')
ds
<xarray.Dataset>
Dimensions:       (lat: 580, lon: 1440)
Coordinates:
  * lat           (lat) float64 -60.0 -59.75 -59.5 -59.25 ... 84.25 84.5 84.75
  * lon           (lon) float64 -180.0 -179.8 -179.5 ... 179.2 179.5 179.8
Data variables:
    random_array  (lat, lon) float64 0.4679 0.7038 0.3218 ... 0.09413 0.121
xarray.Dataset
- lat: 580
- lon: 1440
- lat(lat)float64-60.0 -59.75 -59.5 ... 84.5 84.75
array([-60. , -59.75, -59.5 , ..., 84.25, 84.5 , 84.75])
- lon(lon)float64-180.0 -179.8 ... 179.5 179.8
array([-180. , -179.75, -179.5 , ..., 179.25, 179.5 , 179.75])
- random_array(lat, lon)float640.4679 0.7038 ... 0.09413 0.121
array([[0.46790812, 0.70384265, 0.3217949 , ..., 0.99066462, 0.17896173,
        0.75710259],
       [0.56797323, 0.60090187, 0.63837513, ..., 0.86415796, 0.5610759 ,
        0.17693797],
       [0.74666124, 0.17262882, 0.14981358, ..., 0.06162647, 0.462453  ,
        0.94873145],
       ...,
       [0.21474678, 0.60416556, 0.63095547, ..., 0.81648712, 0.3626262 ,
        0.83673775],
       [0.60234326, 0.12133838, 0.90178623, ..., 0.05333163, 0.89202358,
        0.76202533],
       [0.10804089, 0.91367279, 0.38442562, ..., 0.6915072 , 0.09413142,
        0.1209971 ]])
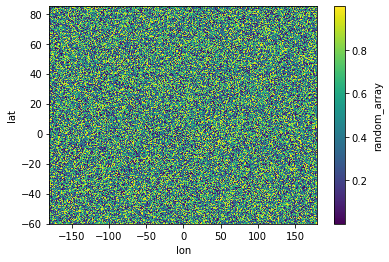
ds.random_array.plot();
url = 'http://www.esrl.noaa.gov/psd/thredds/dodsC/Datasets/noaa.ersst.v5/sst.mnmean.nc'
ds = xr.open_dataset(url, drop_variables=['time_bnds'])
ds
<xarray.Dataset>
Dimensions:  (lat: 89, lon: 180, time: 2007)
Coordinates:
  * lat      (lat) float32 88.0 86.0 84.0 82.0 80.0 ... -82.0 -84.0 -86.0 -88.0
  * lon      (lon) float32 0.0 2.0 4.0 6.0 8.0 ... 350.0 352.0 354.0 356.0 358.0
  * time     (time) datetime64[ns] 1854-01-01 1854-02-01 ... 2021-03-01
Data variables:
    sst      (time, lat, lon) float32 ...
Attributes:
    climatology:                     Climatology is based on 1971-2000 SST, X...
    description:                     In situ data: ICOADS2.5 before 2007 and ...
    keywords_vocabulary:             NASA Global Change Master Directory (GCM...
    keywords:                        Earth Science > Oceans > Ocean Temperatu...
    instrument:                      Conventional thermometers
    source_comment:                  SSTs were observed by conventional therm...
    geospatial_lon_min:              -1.0
    geospatial_lon_max:              359.0
    geospatial_laty_max:             89.0
    geospatial_laty_min:             -89.0
    geospatial_lat_max:              89.0
    geospatial_lat_min:              -89.0
    geospatial_lat_units:            degrees_north
    geospatial_lon_units:            degrees_east
    cdm_data_type:                   Grid
    project:                         NOAA Extended Reconstructed Sea Surface ...
    original_publisher_url:          http://www.ncdc.noaa.gov
    References:                      https://www.ncdc.noaa.gov/data-access/ma...
    source:                          In situ data: ICOADS R3.0 before 2015, N...
    title:                           NOAA ERSSTv5 (in situ only)
    history:                         created 07/2017 by PSD data using NCEI's...
    institution:                     This version written at NOAA/ESRL PSD: o...
    citation:                        Huang et al, 2017: Extended Reconstructe...
    platform:                        Ship and Buoy SSTs from ICOADS R3.0 and ...
    standard_name_vocabulary:        CF Standard Name Table (v40, 25 January ...
    processing_level:                NOAA Level 4
    Conventions:                     CF-1.6, ACDD-1.3
    metadata_link:                   :metadata_link = https://doi.org/10.7289...
    creator_name:                    Boyin Huang (original)
    date_created:                    2017-06-30T12:18:00Z (original)
    product_version:                 Version 5
    creator_url_original:            https://www.ncei.noaa.gov
    license:                         No constraints on data access or use
    comment:                         SSTs were observed by conventional therm...
    summary:                         ERSST.v5 is developed based on v4 after ...
    dataset_title:                   NOAA Extended Reconstructed SST V5
    data_modified:                   2021-04-07
    DODS_EXTRA.Unlimited_Dimension:  time
xarray.Dataset
- lat: 89
- lon: 180
- time: 2007
- lat(lat)float3288.0 86.0 84.0 ... -86.0 -88.0
- units :
- degrees_north
- long_name :
- Latitude
- actual_range :
- [ 88. -88.]
- standard_name :
- latitude
- axis :
- Y
- coordinate_defines :
- center
array([ 88., 86., 84., 82., 80., 78., 76., 74., 72., 70., 68., 66., 64., 62., 60., 58., 56., 54., 52., 50., 48., 46., 44., 42., 40., 38., 36., 34., 32., 30., 28., 26., 24., 22., 20., 18., 16., 14., 12., 10., 8., 6., 4., 2., 0., -2., -4., -6., -8., -10., -12., -14., -16., -18., -20., -22., -24., -26., -28., -30., -32., -34., -36., -38., -40., -42., -44., -46., -48., -50., -52., -54., -56., -58., -60., -62., -64., -66., -68., -70., -72., -74., -76., -78., -80., -82., -84., -86., -88.], dtype=float32) - lon(lon)float320.0 2.0 4.0 ... 354.0 356.0 358.0
- units :
- degrees_east
- long_name :
- Longitude
- actual_range :
- [ 0. 358.]
- standard_name :
- longitude
- axis :
- X
- coordinate_defines :
- center
array([ 0., 2., 4., 6., 8., 10., 12., 14., 16., 18., 20., 22., 24., 26., 28., 30., 32., 34., 36., 38., 40., 42., 44., 46., 48., 50., 52., 54., 56., 58., 60., 62., 64., 66., 68., 70., 72., 74., 76., 78., 80., 82., 84., 86., 88., 90., 92., 94., 96., 98., 100., 102., 104., 106., 108., 110., 112., 114., 116., 118., 120., 122., 124., 126., 128., 130., 132., 134., 136., 138., 140., 142., 144., 146., 148., 150., 152., 154., 156., 158., 160., 162., 164., 166., 168., 170., 172., 174., 176., 178., 180., 182., 184., 186., 188., 190., 192., 194., 196., 198., 200., 202., 204., 206., 208., 210., 212., 214., 216., 218., 220., 222., 224., 226., 228., 230., 232., 234., 236., 238., 240., 242., 244., 246., 248., 250., 252., 254., 256., 258., 260., 262., 264., 266., 268., 270., 272., 274., 276., 278., 280., 282., 284., 286., 288., 290., 292., 294., 296., 298., 300., 302., 304., 306., 308., 310., 312., 314., 316., 318., 320., 322., 324., 326., 328., 330., 332., 334., 336., 338., 340., 342., 344., 346., 348., 350., 352., 354., 356., 358.], dtype=float32) - time(time)datetime64[ns]1854-01-01 ... 2021-03-01
- long_name :
- Time
- delta_t :
- 0000-01-00 00:00:00
- avg_period :
- 0000-01-00 00:00:00
- prev_avg_period :
- 0000-00-07 00:00:00
- standard_name :
- time
- axis :
- T
- actual_range :
- [19723. 80778.]
- _ChunkSizes :
- 1
array(['1854-01-01T00:00:00.000000000', '1854-02-01T00:00:00.000000000',
       '1854-03-01T00:00:00.000000000', ..., '2021-01-01T00:00:00.000000000',
       '2021-02-01T00:00:00.000000000', '2021-03-01T00:00:00.000000000'],
      dtype='datetime64[ns]')
- sst(time, lat, lon)float32...
- long_name :
- Monthly Means of Sea Surface Temperature
- units :
- degC
- var_desc :
- Sea Surface Temperature
- level_desc :
- Surface
- statistic :
- Mean
- dataset :
- NOAA Extended Reconstructed SST V5
- parent_stat :
- Individual Values
- actual_range :
- [-1.8 42.32636]
- valid_range :
- [-1.8 45. ]
- _ChunkSizes :
- [ 1 89 180]
[32152140 values with dtype=float32]
- climatology :
- Climatology is based on 1971-2000 SST, Xue, Y., T. M. Smith, and R. W. Reynolds, 2003: Interdecadal changes of 30-yr SST normals during 1871.2000. Journal of Climate, 16, 1601-1612.
- description :
- In situ data: ICOADS2.5 before 2007 and NCEP in situ data from 2008 to present. Ice data: HadISST ice before 2010 and NCEP ice after 2010.
- keywords_vocabulary :
- NASA Global Change Master Directory (GCMD) Science Keywords
- keywords :
- Earth Science > Oceans > Ocean Temperature > Sea Surface Temperature >
- instrument :
- Conventional thermometers
- source_comment :
- SSTs were observed by conventional thermometers in Buckets (insulated or un-insulated canvas and wooded buckets) or Engine Room Intaker
- geospatial_lon_min :
- -1.0
- geospatial_lon_max :
- 359.0
- geospatial_laty_max :
- 89.0
- geospatial_laty_min :
- -89.0
- geospatial_lat_max :
- 89.0
- geospatial_lat_min :
- -89.0
- geospatial_lat_units :
- degrees_north
- geospatial_lon_units :
- degrees_east
- cdm_data_type :
- Grid
- project :
- NOAA Extended Reconstructed Sea Surface Temperature (ERSST)
- original_publisher_url :
- http://www.ncdc.noaa.gov
- References :
- https://www.ncdc.noaa.gov/data-access/marineocean-data/extended-reconstructed-sea-surface-temperature-ersst-v5 at NCEI and http://www.esrl.noaa.gov/psd/data/gridded/data.noaa.ersst.v5.html
- source :
- In situ data: ICOADS R3.0 before 2015, NCEP in situ GTS from 2016 to present, and Argo SST from 1999 to present. Ice data: HadISST2 ice before 2015, and NCEP ice after 2015
- title :
- NOAA ERSSTv5 (in situ only)
- history :
- created 07/2017 by PSD data using NCEI's ERSST V5 NetCDF values
- institution :
- This version written at NOAA/ESRL PSD: obtained from NOAA/NESDIS/National Centers for Environmental Information and time aggregated. Original Full Source: NOAA/NESDIS/NCEI/CCOG
- citation :
- Huang et al, 2017: Extended Reconstructed Sea Surface Temperatures Version 5 (ERSSTv5): Upgrades, Validations, and Intercomparisons. Journal of Climate, https://doi.org/10.1175/JCLI-D-16-0836.1
- platform :
- Ship and Buoy SSTs from ICOADS R3.0 and NCEP GTS
- standard_name_vocabulary :
- CF Standard Name Table (v40, 25 January 2017)
- processing_level :
- NOAA Level 4
- Conventions :
- CF-1.6, ACDD-1.3
- metadata_link :
- :metadata_link = https://doi.org/10.7289/V5T72FNM (original format)
- creator_name :
- Boyin Huang (original)
- date_created :
- 2017-06-30T12:18:00Z (original)
- product_version :
- Version 5
- creator_url_original :
- https://www.ncei.noaa.gov
- license :
- No constraints on data access or use
- comment :
- SSTs were observed by conventional thermometers in Buckets (insulated or un-insulated canvas and wooded buckets), Engine Room Intakers, or floats and drifters
- summary :
- ERSST.v5 is developed based on v4 after revisions of 8 parameters using updated data sets and advanced knowledge of ERSST analysis
- dataset_title :
- NOAA Extended Reconstructed SST V5
- data_modified :
- 2021-04-07
- DODS_EXTRA.Unlimited_Dimension :
- time
sst = ds['sst']
sst
<xarray.DataArray 'sst' (time: 2007, lat: 89, lon: 180)>
[32152140 values with dtype=float32]
Coordinates:
  * lat      (lat) float32 88.0 86.0 84.0 82.0 80.0 ... -82.0 -84.0 -86.0 -88.0
  * lon      (lon) float32 0.0 2.0 4.0 6.0 8.0 ... 350.0 352.0 354.0 356.0 358.0
  * time     (time) datetime64[ns] 1854-01-01 1854-02-01 ... 2021-03-01
Attributes:
    long_name:     Monthly Means of Sea Surface Temperature
    units:         degC
    var_desc:      Sea Surface Temperature
    level_desc:    Surface
    statistic:     Mean
    dataset:       NOAA Extended Reconstructed SST V5
    parent_stat:   Individual Values
    actual_range:  [-1.8     42.32636]
    valid_range:   [-1.8 45. ]
    _ChunkSizes:   [  1  89 180]
xarray.DataArray
'sst'
- time: 2007
- lat: 89
- lon: 180
- ...
[32152140 values with dtype=float32]
- lat(lat)float3288.0 86.0 84.0 ... -86.0 -88.0
- units :
- degrees_north
- long_name :
- Latitude
- actual_range :
- [ 88. -88.]
- standard_name :
- latitude
- axis :
- Y
- coordinate_defines :
- center
array([ 88., 86., 84., 82., 80., 78., 76., 74., 72., 70., 68., 66., 64., 62., 60., 58., 56., 54., 52., 50., 48., 46., 44., 42., 40., 38., 36., 34., 32., 30., 28., 26., 24., 22., 20., 18., 16., 14., 12., 10., 8., 6., 4., 2., 0., -2., -4., -6., -8., -10., -12., -14., -16., -18., -20., -22., -24., -26., -28., -30., -32., -34., -36., -38., -40., -42., -44., -46., -48., -50., -52., -54., -56., -58., -60., -62., -64., -66., -68., -70., -72., -74., -76., -78., -80., -82., -84., -86., -88.], dtype=float32) - lon(lon)float320.0 2.0 4.0 ... 354.0 356.0 358.0
- units :
- degrees_east
- long_name :
- Longitude
- actual_range :
- [ 0. 358.]
- standard_name :
- longitude
- axis :
- X
- coordinate_defines :
- center
array([ 0., 2., 4., 6., 8., 10., 12., 14., 16., 18., 20., 22., 24., 26., 28., 30., 32., 34., 36., 38., 40., 42., 44., 46., 48., 50., 52., 54., 56., 58., 60., 62., 64., 66., 68., 70., 72., 74., 76., 78., 80., 82., 84., 86., 88., 90., 92., 94., 96., 98., 100., 102., 104., 106., 108., 110., 112., 114., 116., 118., 120., 122., 124., 126., 128., 130., 132., 134., 136., 138., 140., 142., 144., 146., 148., 150., 152., 154., 156., 158., 160., 162., 164., 166., 168., 170., 172., 174., 176., 178., 180., 182., 184., 186., 188., 190., 192., 194., 196., 198., 200., 202., 204., 206., 208., 210., 212., 214., 216., 218., 220., 222., 224., 226., 228., 230., 232., 234., 236., 238., 240., 242., 244., 246., 248., 250., 252., 254., 256., 258., 260., 262., 264., 266., 268., 270., 272., 274., 276., 278., 280., 282., 284., 286., 288., 290., 292., 294., 296., 298., 300., 302., 304., 306., 308., 310., 312., 314., 316., 318., 320., 322., 324., 326., 328., 330., 332., 334., 336., 338., 340., 342., 344., 346., 348., 350., 352., 354., 356., 358.], dtype=float32) - time(time)datetime64[ns]1854-01-01 ... 2021-03-01
- long_name :
- Time
- delta_t :
- 0000-01-00 00:00:00
- avg_period :
- 0000-01-00 00:00:00
- prev_avg_period :
- 0000-00-07 00:00:00
- standard_name :
- time
- axis :
- T
- actual_range :
- [19723. 80778.]
- _ChunkSizes :
- 1
array(['1854-01-01T00:00:00.000000000', '1854-02-01T00:00:00.000000000',
       '1854-03-01T00:00:00.000000000', ..., '2021-01-01T00:00:00.000000000',
       '2021-02-01T00:00:00.000000000', '2021-03-01T00:00:00.000000000'],
      dtype='datetime64[ns]')
- long_name :
- Monthly Means of Sea Surface Temperature
- units :
- degC
- var_desc :
- Sea Surface Temperature
- level_desc :
- Surface
- statistic :
- Mean
- dataset :
- NOAA Extended Reconstructed SST V5
- parent_stat :
- Individual Values
- actual_range :
- [-1.8 42.32636]
- valid_range :
- [-1.8 45. ]
- _ChunkSizes :
- [ 1 89 180]
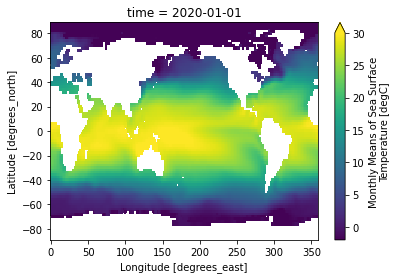
sst.sel(time='2020-01-01').plot(vmin=-2, vmax=30);
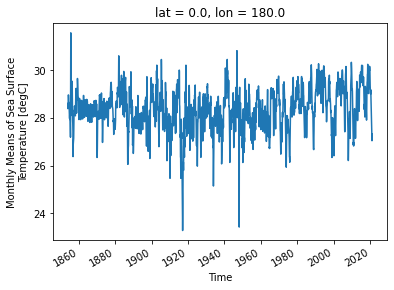
sst.sel(lon=180, lat=0).plot();
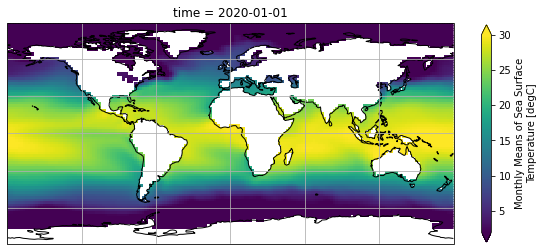
import matplotlib.pyplot as plt
import cartopy.crs as ccrs
fig = plt.figure(figsize=(10, 5))

ax = plt.axes(projection=ccrs.PlateCarree())
ax.coastlines()
ax.gridlines()

sst.sel(
    time='2020-01-01'
).plot(
    ax=ax,
    transform=ccrs.PlateCarree(),
    vmin=2,
    vmax=30,
    cbar_kwargs={'shrink': 0.8}
)

plt.show()
import xesmf as xe
global_grid = xr.Dataset(
    {'lat': (['lat'], np.arange(-60, 85, 0.25)),
     'lon': (['lon'], np.arange(-180, 180, 0.25)),}
)
sst_2021 = sst.isel(time=-1)
regridder = xe.Regridder(
    sst_2021,
    global_grid,
    'bilinear',
    periodic=True # needed for global grids, otherwise miss the meridian line
)
# for multiple files to the same grid, add: reuse_weights=True
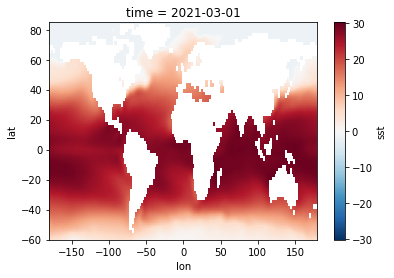
sst_2021_regridded = regridder(sst_2021)
sst_2021_regridded.plot();
For more information, see the documentation.