Cartopy
Cartopy is a library for plotting geospatial data.
import matplotlib.pylab as plt
import cartopy.crs as ccrs
import cartopy.feature as cfeature
import numpy as np
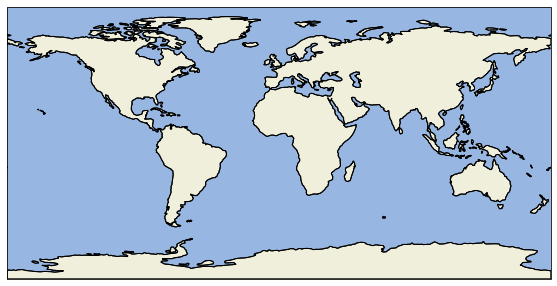
plt.figure(figsize=(10, 5))

ax = plt.axes(projection=ccrs.PlateCarree())

ax.coastlines()
ax.add_feature(cfeature.OCEAN)
ax.add_feature(cfeature.LAND, edgecolor='black')

plt.show()
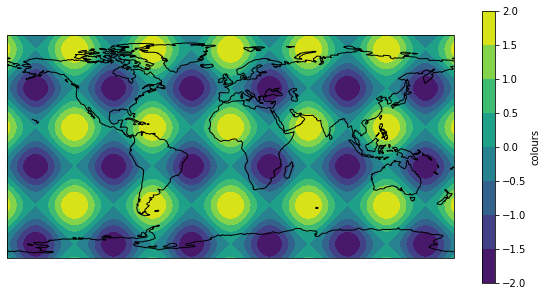
lons = np.arange(-180.0, 180.0, 0.25)
lats = np.arange(-90.0, 90.0, 0.25)

xx, yy = np.meshgrid(lons, lats)

data = np.cos(xx / 10) + np.sin(yy / 10)
plt.figure(figsize=(10, 5))
ax = plt.axes(projection=ccrs.PlateCarree())
im = ax.contourf(xx, yy, data)
ax.coastlines()
plt.colorbar(im, label='colours')
plt.show()
For more information, see the documentation.